 FileRax Best Place To Download

| Developer: | Gnuplot |
| Operating System: | Windows |
| Language: | Multiple languages |
| Version: | 5.2.8 |
| Licence / Price: | Free |
| FileSize: | 33.2 MB |
| Date Added: | 2024/02/07 |
| Total Downloads: | 13 views |
About
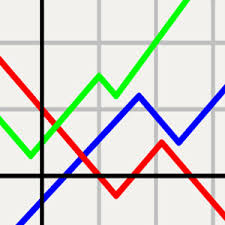
Gnuplot is a powerful and versatile command-line plotting utility for creating high-quality graphs and visualizations of data. Widely used by scientists, engineers, researchers, and analysts, Gnuplot offers a flexible and efficient way to generate a wide range of plots, including 2D and 3D plots, histograms, scatter plots, and more. With its extensive features and customization options, Gnuplot is an essential tool for data analysis, visualization, and presentation in various fields.
Key Features:
- Flexible Plotting: Generate a wide variety of plot types, including line plots, scatter plots, histograms, bar charts, heatmaps, contour plots, and surface plots. Customize plot appearance, styles, colors, and symbols to suit your preferences and data visualization needs.
- Scripting Support: Create plots using simple text-based scripts written in the Gnuplot scripting language. Define data sources, plot settings, and plot types directly in the script file, allowing for reproducible and automated plot generation.
- Data Input Formats: Import data from various file formats, including plain text files, CSV files, TSV files, and more. Process and manipulate data within Gnuplot or preprocess data using external tools before plotting.
- Mathematical Expressions: Incorporate mathematical expressions and functions into plots to visualize mathematical concepts, equations, and data transformations. Perform mathematical operations, calculations, and curve fitting directly within Gnuplot.
- Multiplatform Compatibility: Run Gnuplot on multiple operating systems, including Windows, macOS, Linux, and Unix-like systems. Enjoy consistent performance and functionality across different computing environments.
- Export Options: Export plots to various file formats, including PNG, JPEG, PDF, SVG, EPS, and more. Create publication-quality graphics for inclusion in reports, presentations, publications, and academic papers.
- Interactive Plotting: Use interactive mode to explore data and customize plots in real-time. Interactively adjust plot settings, zoom in on specific regions, and rotate 3D plots for detailed analysis and visualization.
- Batch Processing: Automate plot generation and processing tasks using batch mode. Execute Gnuplot scripts from the command line or integrate Gnuplot into shell scripts, workflows, and automation pipelines for efficient data analysis workflows.
- Extensibility: Extend Gnuplot’s functionality through plugins, extensions, and third-party libraries. Access additional features, plot types, and tools developed by the Gnuplot community to enhance your plotting capabilities.
- Comprehensive Documentation: Access comprehensive documentation, tutorials, examples, and resources to learn Gnuplot and master its features. Benefit from extensive online support, forums, and user communities for troubleshooting and guidance.
Getting Started with Gnuplot:
- Download and install Gnuplot on your operating system from the official website or package manager.
- Launch Gnuplot from the command line or terminal to enter interactive mode.
- Use Gnuplot commands to load data, define plot settings, and generate plots. Refer to the Gnuplot documentation and tutorials for guidance on syntax and usage.
- Experiment with different plot types, styles, and settings to visualize your data effectively.
- Save plots to file formats or integrate Gnuplot into your data analysis workflows and scripts for automated plot generation.
- Explore advanced features, customization options, and extensions to enhance your plotting capabilities and workflow efficiency.
User Reviews:
- “Gnuplot is my go-to tool for generating plots and visualizations in my research projects. Its flexibility and versatility make it indispensable for data analysis and presentation.”
- “I appreciate Gnuplot’s scripting support and batch processing capabilities, which allow me to automate repetitive plotting tasks and streamline my workflow.”
- “As a scientist, I rely on Gnuplot for creating publication-quality plots and graphs. Its extensive features, customization options, and export capabilities meet all my data visualization needs.”
Share Your Thoughts: Have you used Gnuplot for data visualization and analysis? Share your experiences, tips, and favorite features in the comments below! Whether you’re a researcher, analyst, student, or enthusiast, we’d love to hear how Gnuplot has supported your data visualization projects.
Download Now! Unlock the power of data visualization with Gnuplot. Click the download button now to access a versatile and feature-rich plotting utility for your operating system!